Use of the Command Line Interface
After executing the start.py Python script you will enter a Command Line Interface, from there you will be able to
configure and run different simulations. This is useful because you can not only configure multiple simulations at once
but they can be run in a HPC.
This tutorial will provide a step by step guide organised in ‘Parts’. From the most basic use to advance configuration. Feel free to jump to the Part most convenient to you. The tutorial also contains all the commands, an explanation, and the expected results.
Part 1: First simulation using the default values
After executing the Python program start.py you will be asked to enter 8 simulation parameters. All these options have default values
which we will use in this first part. Some of the default options can be seen in the square brackets.
So feel free to press ENTER 8 times. You will see something like this:
1. Enter name of the new simulation [Simulation-20230608133600]: (Press Enter)
2. Enter directory where results are saved [simulation_results]:  (Press Enter)
3. Enter number of agents [100]:  (Press Enter)
4. Enter initial opinion characterisation [io_loc=(0.5, 0.1); io_prt=True]: (Press Enter)
5. Enter model [mod_lab="CB"]:  (Press Enter)
6. Enter agent parameter characterisation [par_rep=(0.2, 0.3, 0.5); par_prt=True]: (Press Enter)
7. Enter underlying digraph characterisation [dig_lab="sw"; dig_tsi=[0, 1, 1, 1]; dig_cpr=0.5; dig_prt=True]: (Press Enter)
8. Enter number of time-step [50]: (Press Enter)


Creating initial opinions
Initial opinions created


Creating adjacency matrix
Creating a Small-World Digraph with 100 agents, 1.0 positive edge ratio
Adjacency matrix created


Creating agent parameters
Agent parameters created


Running the model
Simulation complete
After this, a directory called Simulation-20230608133600 should have appeared in the simulation_results directory,
and it should contain four .png images. The four images are:
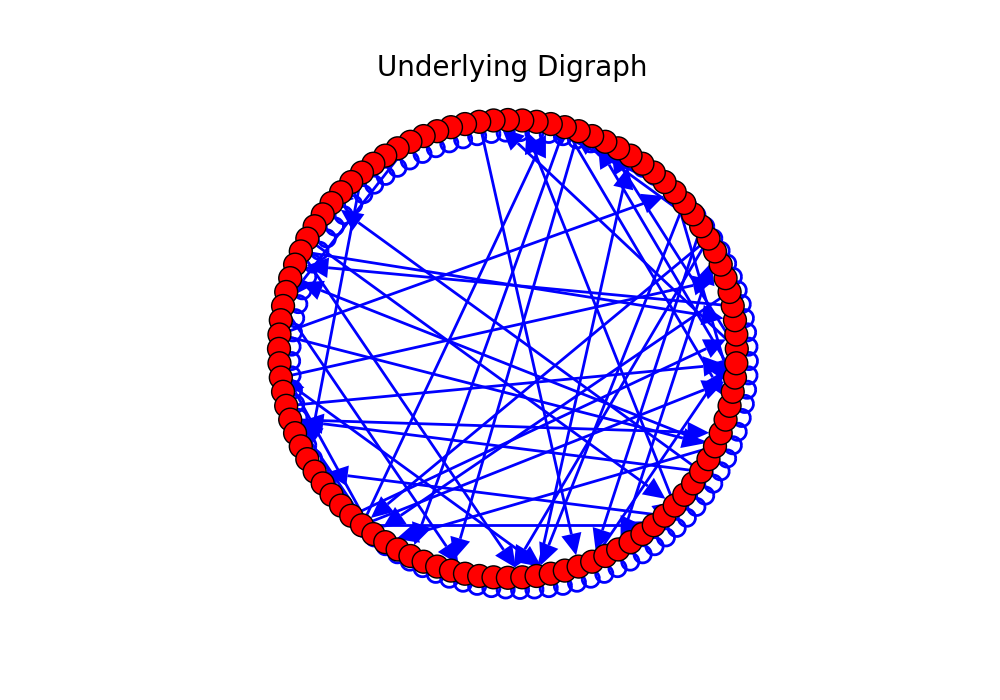
Randomly generated underlying digraph
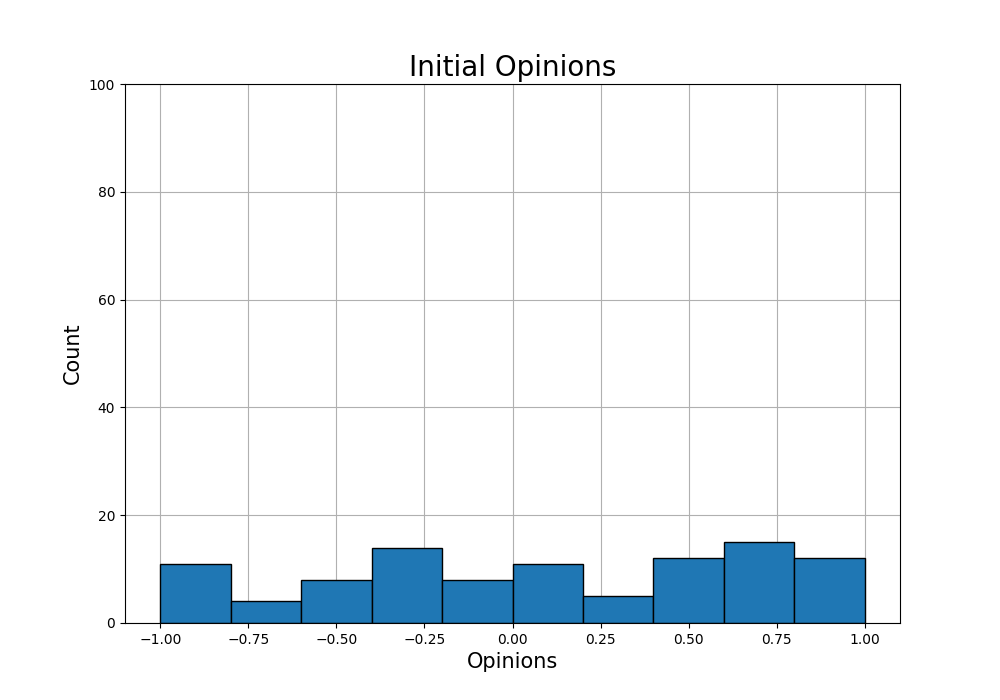
Initial opinion histogram
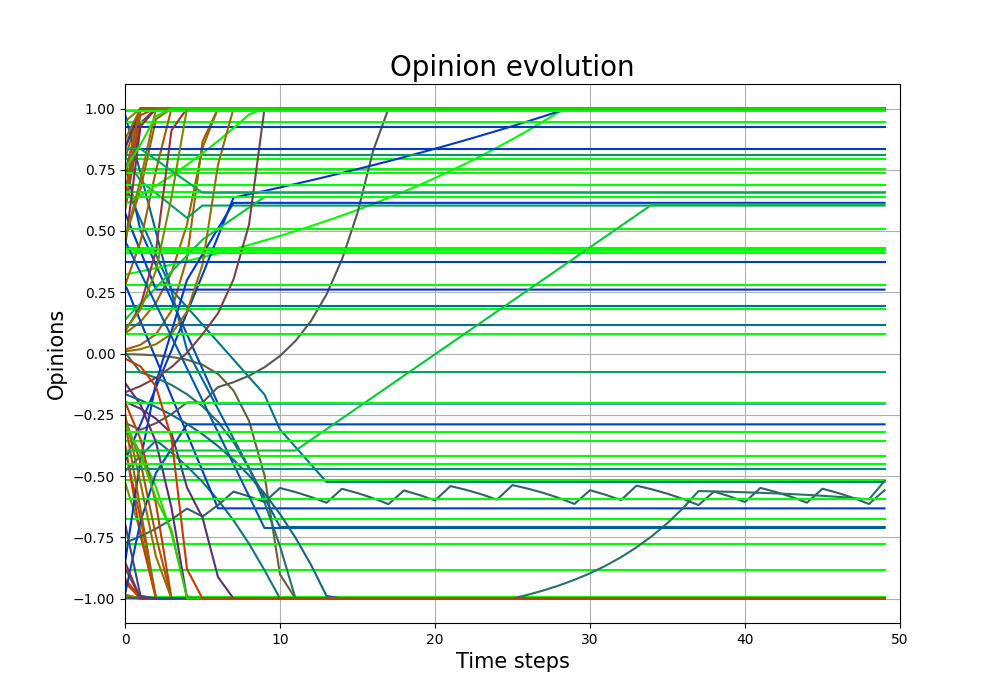
Opinion evolution

Final opinion histogram


The resulting directory and images in your case will be different, this is beacuse: (i) the name of the directory uses the current date and time, and (ii) the initial opinions, and underlying digraph are created randomly.
So what just happened, and what does all this mean? Let’s go step by step:
Enter name of the new simulation: here you enter the name of the simulation, it can be anything. By default the name isSimulation-YYYYMMDDHHMMSS, whereYYYYMMDDHHMMSSare the numbers of year, month, day, hour, minute, and second. This is done so that the names are different and there is no overwritting.Enter directory where results are saved: it is hte name of the directory where the results are saved, by default it is thesimulation_resultsdirectory, but it can be changed. If that directory does not exist, it is created.Enter number of agents: it should be a positive integer, representing the number of agents in the simulation. By default it is 100.Enter initial opinion characterisation: here the parameters for the generation of the initial opinions are introduced this filed accepts 5 possible parameters: (we will see the syntax for introducing new parameters later)io_loc: Location of the initial opinions in the Agreement Plotio_tol: Tolerance for the transformation of the opinions.io_met: Method of opinion transformation.io_dis: Initial distributionio_prt: Boolean determining if the histogram is printed or not.
Enter model: here the parameters of the simulation model are introducedmod_lab: Label of the modelmod_par: Additional model-specific parameters
Enter agent parameter characterisation: here the agent parameter models are introducedpar_rep: Representation of the parameterspar_tol: Tolerance for the transformation of the parameterspar_dis: Initial distributionpar_prt: Boolean determining whether the agent parameter representation is printed or not.
Enter underlying digraph characterisation: underlying digraph parametersdig_lab: Label of the digraph topologydig_res: row_stochasticdig_per: positive_edge_ratiodig_tsi: topology_signaturedig_cpr: change_probabilitydig_rpr: reverse_probabilitydig_bpr: bidirectional_probabilitydig_rei: num_random_edges_itdig_epr: edge_probabilitydig_prt: Boolean determining whether the underlying digraph plot is printed or not.
Enter number of time-step: positive integer determining the number of time steps.
How to add model parameters
The addition of model parameters follows the next rules:
write the name of the parameter, followed by an equal sign
=and then the value of the parameter. Depending on the parameter, the value may be an integer, a floating number, a tuple, a string, or a boolean;separate parameters by semicolons
if a parameter name is repeated, only the first value is used
New inputs overwrite the default values
Example: The input
'dig_lab="sw"; dig_tsi=[0, 1, 1, 1]; dig_cpr=0.5; dig_cpr=0.2; dig_prt=True'
passes the following values to the program:
the string
swto the parameterdig_labthe list
[0, 1, 1, 1]to the parameterdig_tsithe float
0.5to the parameterdig_cprbecause it was the first value that was passedthe boolean
Trueto the parameterdig_prt
You can always type help to receive an explanation of the corresponding parameter and the options